HISTORICAL EVOLUTION OF CITY OF CINCINNATI AND DEVELOPMENT WITHIN HAMILTON COUNTY, OHIO
‘Evolution’ can be defined as the gradual advancement related to something, whereas ‘Development’ is the process of experiencing the change over the period of time. Human settlements has played an important role in the evolution and development of the places. Also, human settlement can be treated as a major indicator in mapping the patterns in order to understand the evolution and development at a given geographic location. Exploring that can help in understanding that how a particular place grew spatially over the period of time.
This study focuses on mapping the patterns of evolution of city of Cincinnati and development within Hamilton County, Ohio, taking into consideration the ‘Built Year’ for a structure on a land parcel. Built year indicates the permanent and fixed form of settlement.
This study focuses on mapping the patterns of evolution of city of Cincinnati and development within Hamilton County, Ohio, taking into consideration the ‘Built Year’ for a structure on a land parcel. Built year indicates the permanent and fixed form of settlement.
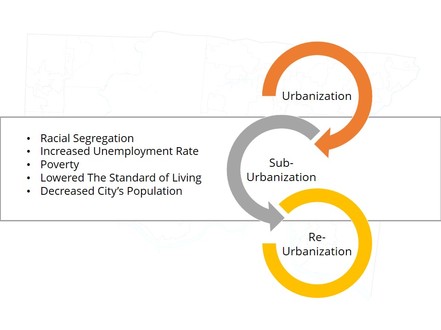
The American history of human settlement has a distinct pattern that started with urbanization followed by sub-urbanization and in coming future predicted to be re-urbanization. All the rust belt cities like Detroit, Cleveland, Dayton and Cincinnati has experienced this patterns of changes. Prior World War II, urbanization happened to these cities but Post World War II was the time of suburbanization. During suburbanization, some cities experienced first ring suburbs and when first ring was saturated that gave rise to second ring of suburbs. Eventually, making inner cities deserted and non-functional. This was greatest shift in the history of American human settlement that resulted in many social issues like racial segregation, increased unemployment rate, poverty, lowered the standard of living and decreased city’s population.
The City of Cincinnati has experienced the burgeoning glory as well as the decline. The decline of the city was accompanied by the shift in population and change in their housing preferences. The new growth was pushed towards the outer rings of Cincinnati. While moving away from the city people preferred to live lavish and spaciously in houses that eventually increased the number of single family houses significantly in the Hamilton County. Such outward growth impacted the market value of property and housing vacancy in the inner areas of city of Cincinnati.
The City of Cincinnati has experienced the burgeoning glory as well as the decline. The decline of the city was accompanied by the shift in population and change in their housing preferences. The new growth was pushed towards the outer rings of Cincinnati. While moving away from the city people preferred to live lavish and spaciously in houses that eventually increased the number of single family houses significantly in the Hamilton County. Such outward growth impacted the market value of property and housing vacancy in the inner areas of city of Cincinnati.
OBJECTIVES
DATA AND DATA SOURCES
- To study and analyze the patterns of evolution and development for the city of Cincinnati extending into the suburbs within the Hamilton County limits.
- To observe the composition and spatial arrangement of parcels with respect to their land use.
- To map the sub-urbanization with respect to time and to identify the peak periods of development.
- To identify the distribution of total market value for residential properties in the Hamilton County.
- To analyze the areas with concentrations of vacant housing units in the Hamilton County.
- To examine if there is any correlation between the built year, the total market value of the property and vacant housing units.
DATA AND DATA SOURCES
- Land Parcel, Hamilton County, Civil Boundaries within the Hamilton County, Census tracts and water features shapefiles were acquired from The Cincinnati Area Geographic Information System (CAGIS).
- Built Year for the buildings on the land parcels was obtained from the University of Cincinnati - Economics Center, who had requested this dataset from the Hamilton County Auditor. The dataset file was of the year 2012 that included information for structure built from 1800 to 2010.
- Land use and Total Market Value attributes for the buildings taken into consideration were extracted from the Land parcel shapefile from CAGIS.
- Vacant Housing Units data for the census tracts within the Hamilton County was extracted from the U. S. Census Bureau – American FactFinder. The table that was downloaded for the purpose of analysis was – B25004 VACANCY STATUS (2009-2013 American Community Survey 5-Year Estimates)
DATA CHALLENGE AND CONSTRAINT
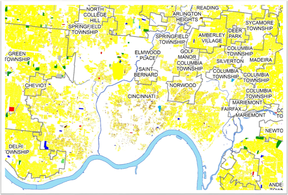
The dataset of ‘Built Year’ for the buildings, obtained from the Hamilton County Auditor had some issues with respect to its records. The dataset did not have information for the majority of the buildings in the city of Cincinnati, especially in and near the downtown regions of Cincinnati. I assume that those missing information records belongs to the buildings that might have been torn down to make new structures on the same site. Therefore, the buildings information for those old structures did not match that resulted in a significant loss in data. The following image explains the data challenge faced, the white space indicates the missing building records from the Auditor’s data. The analysis was carried with available records from the dataset.
The dataset of ‘Built Year’ for the buildings, obtained from the Hamilton County Auditor had some issues with respect to its records. The dataset did not have information for the majority of the buildings in the city of Cincinnati, especially in and near the downtown regions of Cincinnati. I assume that those missing information records belongs to the buildings that might have been torn down to make new structures on the same site. Therefore, the buildings information for those old structures did not match that resulted in a significant loss in data. The following image explains the data challenge faced, the white space indicates the missing building records from the Auditor’s data. The analysis was carried with available records from the dataset.
METHODOLOGY
The aspects like Parcel Land Use, Built Year, Total Market Value for the property and Vacant Housing Units were considered to analyze the impact of urbanization and suburbanization in the Hamilton County.
The land parcel with Congregated Housing and Public Utilities uses were eliminated from the analysis, since the total number of parcel for each of them were considerably low. Then, the analysis was carried out with the rest of the land use parcels.
In order to study the patterns in evolution of Cincinnati city and development within the Hamilton County, ‘Built Year’ for the buildings was taken into consideration. The dataset from the Hamilton County Auditor has the information for each parcel that has a built structure on it. With the help of Parcel ID, the auditor’s data was joined to land parcels obtained from the CAGIS.
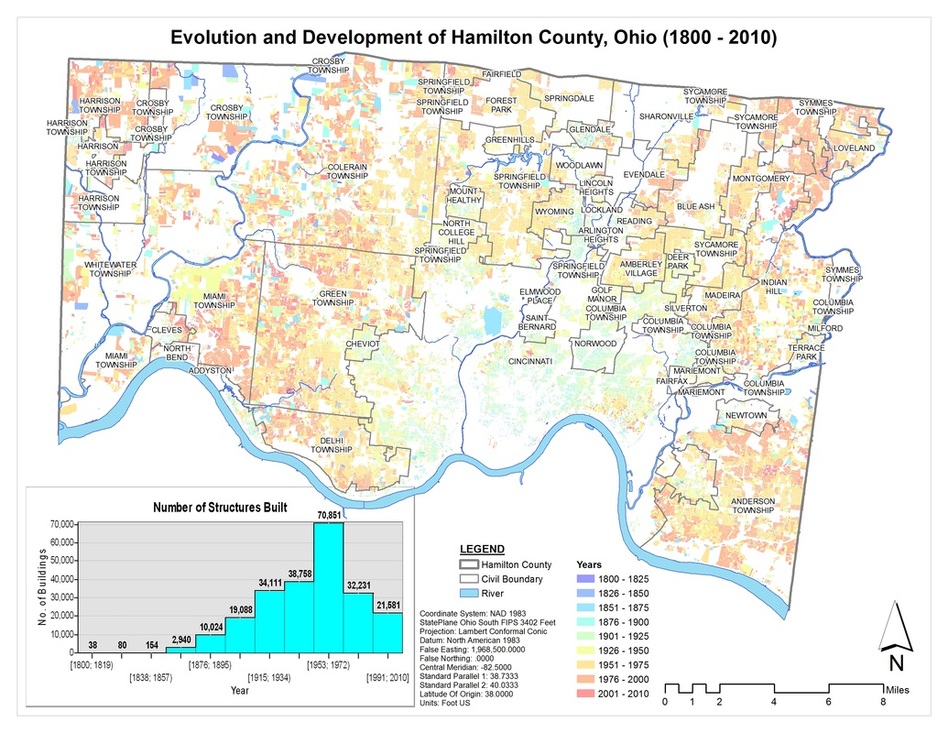
The temporal animation tool from ArcMap was identified as a best tool for the visualization of dataset to depict the evolution of city of Cincinnati and development within the Hamilton County with respect to time. The land use data of parcel and built years were used to develop the animation. This also helped in understanding the dominance of major land uses throughout the Hamilton County. Furthermore, to analyze the peak period of development wherein maximum number of structures were built, the same ‘Built year’ information was used to aggregate the number of structure spanning from the year 1800 to 2010.
The Total Market Value Analysis for the land parcels within the Hamilton County was done with the land parcel data that had an attribute named ‘Total Market‘. Additionally, the vacant housing units’ data from U. S. Census Bureau for the census tracts within the Hamilton County was used to analysis the housing vacancy pattern.
RESULTS
There was a significant urban sprawl for the city of Cincinnati at the time of sub-urbanization that started from the year 1960s. The first ring of suburb can be observed during 1960s, whereas the second ring of suburb started forming in 1980s.
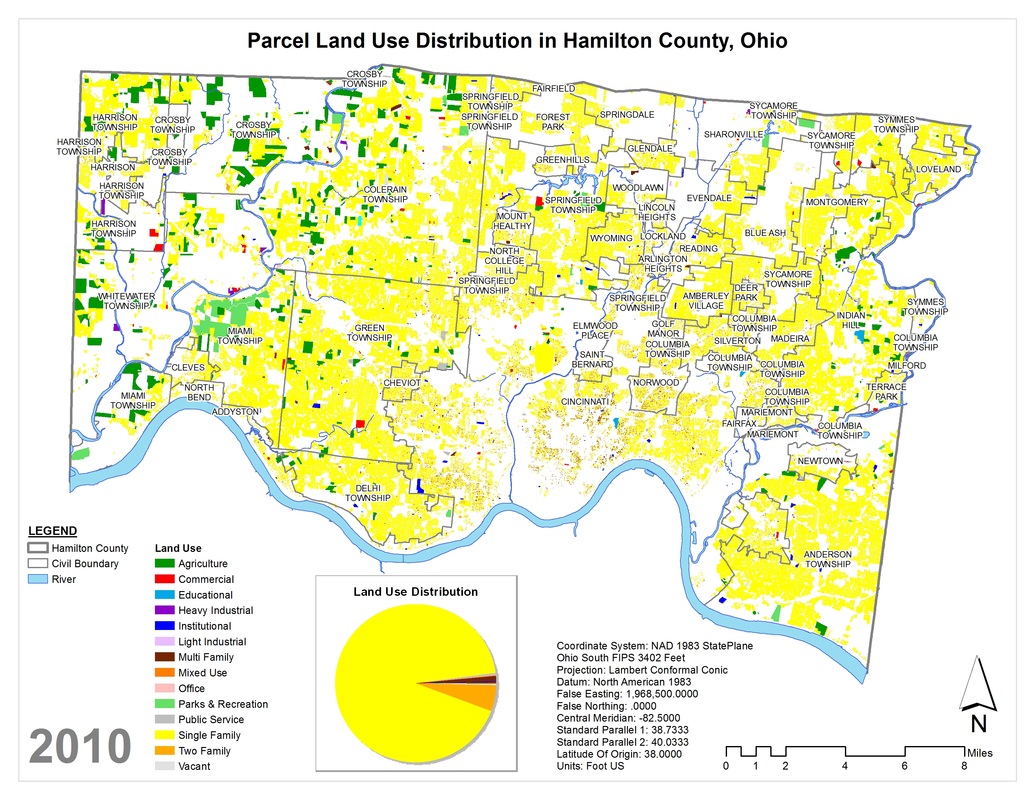
The overall parcel land use pattern in predominantly Single Family Housing that account for approximately 80% of the total land use, followed by the Two Family and Multi Family Housing. The concentration of agricultural land can be seen in the northern and western parts of Hamilton County.
The aspects like Parcel Land Use, Built Year, Total Market Value for the property and Vacant Housing Units were considered to analyze the impact of urbanization and suburbanization in the Hamilton County.
The land parcel with Congregated Housing and Public Utilities uses were eliminated from the analysis, since the total number of parcel for each of them were considerably low. Then, the analysis was carried out with the rest of the land use parcels.
In order to study the patterns in evolution of Cincinnati city and development within the Hamilton County, ‘Built Year’ for the buildings was taken into consideration. The dataset from the Hamilton County Auditor has the information for each parcel that has a built structure on it. With the help of Parcel ID, the auditor’s data was joined to land parcels obtained from the CAGIS.
The temporal animation tool from ArcMap was identified as a best tool for the visualization of dataset to depict the evolution of city of Cincinnati and development within the Hamilton County with respect to time. The land use data of parcel and built years were used to develop the animation. This also helped in understanding the dominance of major land uses throughout the Hamilton County. Furthermore, to analyze the peak period of development wherein maximum number of structures were built, the same ‘Built year’ information was used to aggregate the number of structure spanning from the year 1800 to 2010.
The Total Market Value Analysis for the land parcels within the Hamilton County was done with the land parcel data that had an attribute named ‘Total Market‘. Additionally, the vacant housing units’ data from U. S. Census Bureau for the census tracts within the Hamilton County was used to analysis the housing vacancy pattern.
RESULTS
There was a significant urban sprawl for the city of Cincinnati at the time of sub-urbanization that started from the year 1960s. The first ring of suburb can be observed during 1960s, whereas the second ring of suburb started forming in 1980s.
The overall parcel land use pattern in predominantly Single Family Housing that account for approximately 80% of the total land use, followed by the Two Family and Multi Family Housing. The concentration of agricultural land can be seen in the northern and western parts of Hamilton County.
The number of structures built from the year 1800 to 2010, gives an impression about at what rate the development was happening. There was a significant amount of structures constructed from 1960 to 1990 that were about approximately 100,000 units. Furthermore, after 1990s there was a decline in the construction activity.
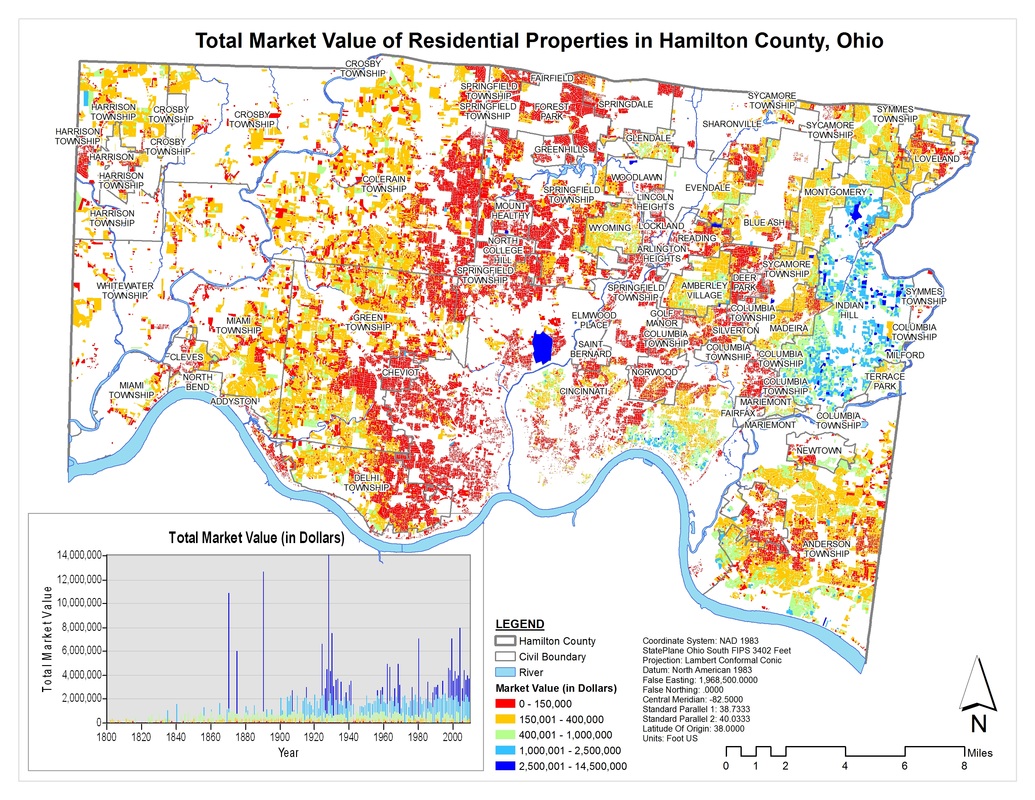
The map of Total Market Value of Residential Properties shows the spatial distribution of properties with respect to the market value. Market value for the properties in the city of Cincinnati is lowest compared to the other parts of Hamilton County. Sub-urbanization can be one of the reason behind lower total market value in the city of Cincinnati. The properties in eastern part of Hamilton County has higher Market Value compared to western and central part of Hamilton County. The market value is highest in Indiana Hill which is in eastern part of Hamilton County. Spring Grove Cemetery in the Spring Grove Village neighborhood stands out distinctly, as it is one of the properties with the higher market value that may be because of its larger land area. Also, the graph indicates that the built year for the structures that has the total market value in today’s context. From the graph it can be said that the most expensive properties were built in between the year 1920 to 1940.
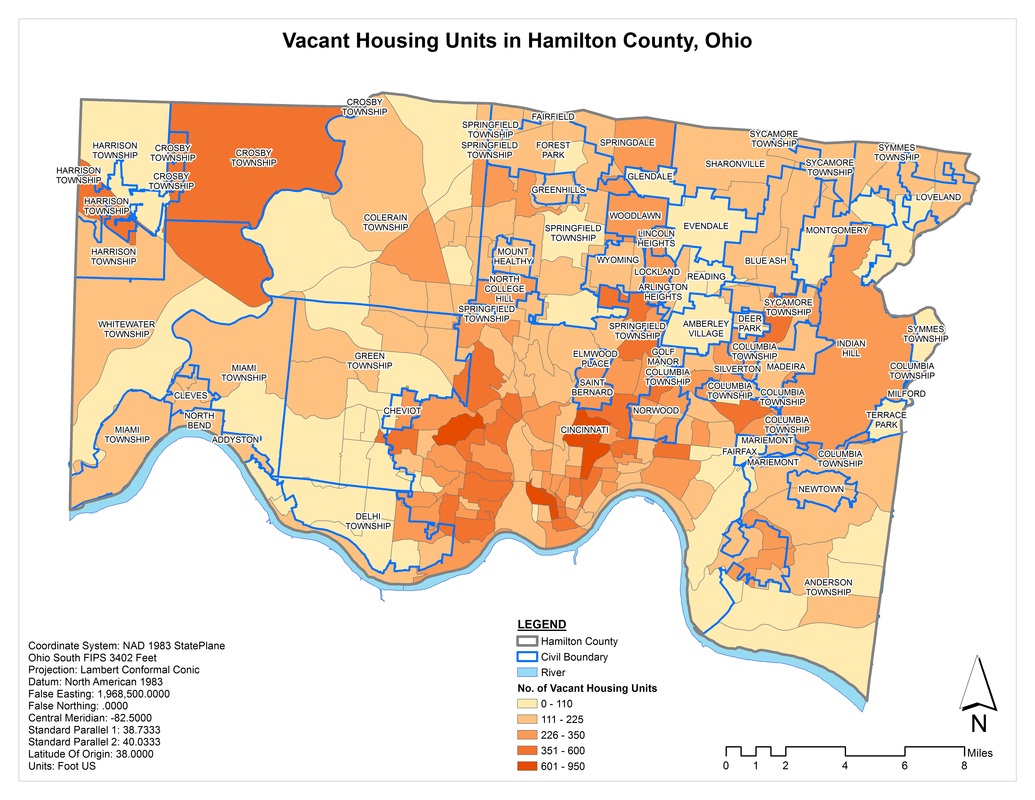
The map of Vacant Housing Units in the Hamilton County shows spatial distribution of vacant houses with respect to the census tracts. The Crosby Township and major part of Cincinnati city has higher number of vacant houses. Indian Hill which has the expensive residential properties has the significant amount of vacant houses.
CONCLUSION
There does exist a correlation between the built year, the total market value of the property and vacant housing units. For the city of Cincinnati, the development happened first within the city limits and then sprawled outside the city that resulted the structures within the city limits with lower total market value and higher number of vacant housing.
REFERENCES
City of Cincinnati. Cincinnati Area Geographic Information System (CAGIS). 2012. http://cagismaps.hamilton-co.org/cagisportal/mapdata/download (accessed April 29, 2015).
Hamilton County Auditor Dusty Rhodes. County Auditor On-Line. 2015. http://www.hamiltoncountyauditor.org/ (accessed April 29, 2015).
U.S. Census Bureau . American FactFinder. n.d. http://factfinder.census.gov/faces/nav/jsf/pages/index.xhtml (accessed April 29, 2015).
